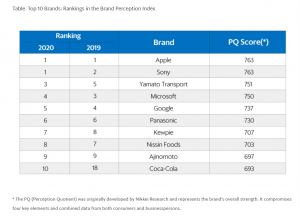
TOKYO, JAPAN, April 5, 2021 /EINPresswire.com/ -- Apple and Sony were both ranked in the top position in the 2020 Nikkei Research's "Brand Perception Index." Microsoft (4th), Google (5th) and Coca-Cola (10th) were also present in the top ten list, together with a number of Japanese domestic brands. In 2020, Apple again defended its No.1 position of the previous year, while Microsoft and Google each dropped in the rankings by one place. Coca-Cola experienced a great lift, rising to 10th place from 18th.
Nikkei Research?s ?Brand Perception Index? is derived from a large-scale survey held annually. The underlying data is a composition of facts, thoughts and emotions collected from both consumers and businesspersons, stacking up to over 200 data points from each respondent.
THE COMPETITIVE LANDSCAPE
Rather than solely taking ranking number into account, it is important to compare each brand with the right competitors. However, this can be tricky sometimes, as the definitions of ?industry? and ?market? can differ in a variety of ways. Many enterprises operate multiple business segments, and information on companies that are in other industries can also be of great value. Do not worry ? because we measure 600 brands across broad variety of industry sectors, it will be easy for you to find and select the right competitors.
TRAJECTORY THROUGH THE DECADE
We store and make available data for over 15 years. Whether you want to check the performance year-by-year or examine the impact of a significant incident in the past, the information is here.
PERFORMANCE DEEP-DIVE
The index is derived from key elements used to evaluate brand equity. You can conduct comparisons with your competitors and gain a more profound understanding of your current position. Alternatively, you can compare your score year-by-year to check performance and determine whether your corporate branding activities have been making expected good progress.
UNDERLYING METHODOLOGY
Since 2003, Nikkei Research has been measuring the strength of the corporate brands that operate in Japan. In 2020, the 18th survey collected responses from 47,136 consumers and 46,636 businesspersons in total, averaging nearly 800 responses for each brand. The 600 brands were carefully chosen broadly across 60 distinctive industry sectors, with consideration given to market share, revenues and other influential economic factors.
Covered industry segments: Food & Beverage, Petroleum, Chemical, Materials, Vehicles, Electronics, Precision Machinery, Pharmaceuticals, CPG/FMCG, Other Manufacturing, Trading, Retail, Finance/Insurance, Construction, Real Estate, Transportation, Electricity/Gas, Service, Restaurants, IT/telecommunication, Software, Consulting
Example lists of foreign brands included: 3M, Adidas, Adobe, Amazon, American Express, Apple, BMW, Facebook, GE, Google, HP, IBM, Intel, LG, Mercedes-Benz, Microsoft, MSD, Nike, Oracle, Samsung, SAP, Starbucks, Tesla, Uber, Visa, Volkswagen, Walt Disney
To see further details and for inquiry, please access our website from the link below.
Nikkei Research?s ?Brand Perception Index?
https://www.nikkei-r.co.jp/english/column/7656
Public Relations Office
Nikkei Inc.
pr@nex.nikkei.co.jp


